Introduction:
When it comes to scaling, there is a common misconception that “bigger always means better”. This misconception is also traceable to agile arena, where companies look for ways to expand their agile practices beyond a single organizational domain (e.g. many teams, numerous departments, multiple lines of business, etc.). Usually, it is an existing (inherited) organizational complexity that becomes the main reason why companies look for complex, multi-tiered scaling solutions. And of course, if there is a demand, there will be a supply: there is a number of frameworks out there that hand-hold companies to comfortably “embrace” their existing complexity and not feel too uncomfortable about their own internal dysfunctions.
However, not all scaling solutions are as “forgiving”J. There are some agile frameworks that intentionally expose and boldly challenge organizational deficiencies. One of such frameworks is Large Scale Scrum (LeSS). In order to set a stage for the rest of this discussion, I would like to summarize a few points about LeSS here.
I also would like to express my appreciation and acknowledgement to Craig Larman (one of co-founders of LeSS) for helping me deepen and broaden my understanding of organizational design and improve my system thinking that I have been developing over years.
Brief Overview of LeSS:
LeSS is a very easy to understand. I like to speak metaphorically, so in describing LeSS, I sometimes use analogy with a legendary assault rifle AK-47 that has the following, well-known characteristics:
- it has very few moving parts and, therefore, its internal friction is pretty low; also not too many small pieces that can jam or break
- it is simple to disassemble, inspect and reassemble (inspection & adoption)
- it is very reliable and adoptable under tough conditions (rarely fails in action)
- if necessary, it can be modified and “expanded”, at low cost/low effort
But there is something else about LeSS that makes its analogy to a weapon (probably, not just to AK) appropriate: it assaults organizational dysfunctions.
LeSS also has two important characteristics:
- It is very simple in design and fully rests on core principles of basic Scrum (Effectively, LeSS is the same Scrum, as it is described in Scrum Guide, but performed by multiple teams)
- LeSS teachings rest on the pillars of:
- Lean Thinking: “watching the baton, not the runner”, visual management, cadence, time-boxing, managers being teachers, continuous improvement
- System Thinking: Weinberg-Brooks’ Law, Queueing Theory, indirect benefits of managing batch size and cycle time, being customer-centric, explain differences between local and system optimization).
Thanks to these two key characteristics, LeSS is a very powerful mechanism that helps seeing an organization systemically/holistically, while identifying and exposing (analogy, to a high power rifle scope is suitable here) its pain points that need to be addressed.
As a framework, LeSS is lean and transparent. It does not have any “secret pockets” or “special compartments”, where organizational problems can find safe heaven. No dysfunctions escape sharp focus of LeSS: ineffectively applied processes or tools, ill-defined roles and responsibilities, unhealthy elements of organizational culture and other outdated norms – all of this gets vividly exposed, when using LeSS. Interestingly, while LeSS is a scaling framework that allows to scale-up (roll-up) efforts made by multiple scrum teams, it requires organizational de-scaling to be performed first. The metaphor that I often use at here is: “you can get more with LeSS”. To put it another way, in order to build-up Scrum effectively, an organization must remove whatever extra/unnecessary “muda” (waste) it has already accumulated that gets in a way of scaling Scrum. It is almost like this: LeSS prefers thin but very strong foundational layer, over thick and convoluted but unstable foundational layer, with the ladder, usually being a characteristic of an orthodox, archaic organizational design.
Another metaphor that I use to describe LeSS is that it is an organizational design mirror. By adopting LeSS, an organization sees its own reflection and depending on its strategic goals and appetite for change, decides on necessary improvements. Similarly, to a person who takes his personal fitness training seriously and uses a mirror for “course correction”, an organization may use LeSS to decide if any further re-shaping or “trimming” is required to get to a next maturity level.
LeSS is also a great guide to technical excellence. I have used LeSS teachings extensively to coach the importance of continuous integration, continuous delivery, clean code, unit testing, architecture & design, test automation as well as some other techniques that make agile development so great. LeSS stresses that mature engineering practices are paramount for effective adoption of agile across multiple organizational domains, not just IT.
Discussion
So, how can an organization take advantage of both: simplicity of LeSS construct, on one hand, and its deep systemic views, on the other hand – to improve its organizational agility beyond a single team? How can principles of lean and system thinking – together, and along with understanding ‘beyond-first-order’ system dynamics be leveraged to implement true scrum, without reducing, minimizing or downplaying importance of its core values and principles?
As an organizational and agile coach and someone who has been using LeSS extensively in his daily coaching work, I frequently witness situations when companies have to deal with this serious dilemma. Here, I want to share the magic “glue” that helps me bring my thoughts together and deliver them to my clients. This “glue” is one of the most effective tools that I have discovered for myself inside the LeSS toolbox. It is called Causal Loop Diagrams (CLD).
CLDs – are a great way to graphically illustrate cause & affect relationships between various elements of an organizational ecosystem. CLDs help me effectively uncover second and third order system dynamics that may not as apparent to a naked eye, as first order dynamics. CLDs help me brainstorm complex organizational puzzles and conduct deep analysis of system challenges. Ultimately, I have found that CLDs are a great way to communicate ideas to my customers, particularly, to senior leadership.
Here are some elements of CLDs that I use in my graphics:
- Goals – high, overarching/strategic goal that needs to be achieved
- Variables – system elements that have effect/make influence on other system elements (other variables)
- Causal links – arrows that connect two related variables
- Opposite effects – “O” annotation near an arrow; suggest that effect of one variable on another variable is opposite to what could be expected
- Delayed effect – “||” annotation that disrupts a causal link (arrow); it implies that there is a delayed effect of one variable by another variable
- Extreme effects – one variable has an extreme (beyond normal) effect on another variable; it is represented by a thick arrow
- Constraints – “C” annotation near arrow; implies that there is a constraint on a variable
- Quick- Fix reactions – “QF” annotation near an arrow; action that brings about short-term, lower cost effect
At this point, I would like to provide an example of using CLDs, to visually illustrate second and third order dynamics between key system variables that I often see cause harm and unrest to organizational: performance-driven, discretionary monetary incentives.
I would like to follow through the process of interaction between system variables as they come to play with one another and uncover the impact they have on the overall system.
Every year, a company (hypothetical Company X) has to distribute a large sum of money to many of its employees in the form of discretionary bonuses. In order to make a decision-making process less subjective, a company ties it to employees’ individual performance: reviews and appraisals. People that have demonstrated better performance, get more money, people that have demonstrated poorer performance – get less (or nothing). This requires that every employee gets evaluated by her line manager, usually, twice every year, at which time an employee gets some rough idea about “how much she is worth as resource”. This serves as a guide to how much discretionary money an employee might be expecting to get, as a bonus. While at its surface, the process of performance evaluations and appraisals may seem to be more objective, than a line manager just simply deciding on his own, it is still very subjective as an employee’s opinion is disregarded, when making decisions. Furthermore, the process is harmful and causes deterioration of individuals’ morale and relationships, on multiple fronts. Undesirable effects and short-/long-term damage of performance evaluations and appraisals have been studied for years; lots of research and statistical data is available today. If a reader is not well familiar with this topic or requires additional background information to deepen his understanding, he may refer to the following resources, prior to proceeding with reading:
- Linking Monetary Incentives to Appraisals, by Gene Gendel (white paper)
- Get Rid of the Performance Review!: How Companies Can Stop Intimidating, Start Managing–and Focus on What Really Matters, by Samuel A. Culbert
- Abolishing Performance Appraisals: Why They Backfire and What to Do Instead, by Tom Coens and Mary Jenkins
- Punished by Rewards: The Trouble with Gold Stars, Incentive Plans, A’s, Praise, and Other Bribes, by Alfie Kohn
- Hard Facts, Dangerous Half-Truths And Total Nonsense: Profiting From Evidence-Based Management, by Jeffrey Pfeffer and Robert I. Sutton
- Out of the Crisis (MIT Press), by W. Edwards Deming
Moving along with this discussion, I would like to highlight the following three downstream “system variables” that are directly (first order dynamics) impacted by individual performance reviews. This type of system variables integration is mainly observed among technology groups. Once we understand a first order dynamics, we shall proceed to some other downstream (“beyond first order”) variables.
Employee Happiness Factor
Many research studies have proved that employees don’t like to be appraised. An appraisal is equivocal to slapping a price tag on someone and is hardly an objective process, as the only opinion that really matters is that of a line manager. Yet, an official version at almost any company is that an appraisal helps an employee grow and mature professionally and offers a way to improve her individual performance towards some arbitrarily set target. Truth to be told: was the intent of appraisals to help employees grow and continuously improve, the process would not be implemented once or twice a year, but rather, more frequently, in ways that would allow an employee to make a necessary course correction more iteratively. After all, why wait for 6 months to tell a worker that she needs to improve?
At the time of appraisal, a manager delivers to an employee her final and practically undisputed decision. An employee has practically no effective way to challenge or dispute such decision. Frequently, even a line manager does not have control of the process (although, this is rarely admitted): he or she is presented with a fixed “bag of cash”, coming from management above, and this bag, somehow, has to be distributed among lower-ranking workers. And just to be fair to line managers that are not delusional about the dysfunction they have to entertain, most of them also dislike the process as it makes them annihilated and resented by their own employees.
So, as time goes by, employees become less and less pleased with evaluations and appraisals. The impact may not be observed immediately due to the fact that it usually takes time for an employee to mentally mature to the point, where she becomes conscious and begins comprehend the unfairness and lawfulness of the process. (Of course, exceptions exist among people that have longer experience of dealing with this process and understand its ineffectiveness and harm.)
While leveraging, CLDs in my discussions with senior management, I use the following graphic representation and annotation to convey the concept:
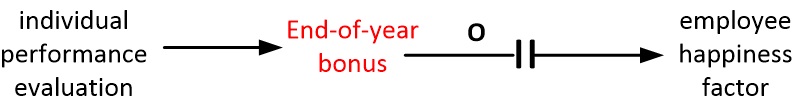
This graphic suggests that annual appraisals have delayed and opposite effect on employees’ happiness.
Peer to Peer Support
Peer-to-peer support, willingness to share knowledge with colleagues, collective ownership of assignments and shared responsibility for deliverables – these are the hallmarks not only of feature teams’ dynamics but of any agile environment. In order for employees to be mutually supportive, they must operate in non-compete environment, where they don’t view each other as competitors or rivals. This is practically impossible to achieve when every employee perceives another employee (at least within the salary ranking tier) as a competing bonus collector. And this is exactly what is observed in environments, where bonuses are distributed, based on individual performance: employees compete for the same, limited pool of cash. But everyone cannot be a winner: even if a group of brightest individuals, working together, someone within that group would have to be ranked higher and someone – lower (and btw, people are frequently explained this upfront). How could we expect people to be supportive of each other if, effectively, underperformance of one employee and her inability to collect extra money increases chances of another employee to bring home more cash? Performance appraisals and discretionary moneys drive employees apart, not together.
Again, the adverse results of appraisals may not be immediate: pain points become more obvious after bonuses are actually paid (end-of-year/early-next-year) – this is when employees start developing resentment and jealousy towards each other over paid bonuses.
While leveraging, CLDs in my discussions with senior management, I use the following graphic representation and annotation to convey the concept:
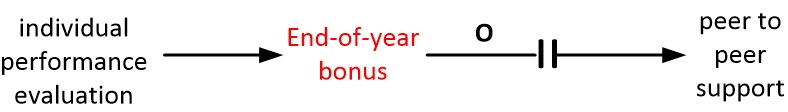
This graphic suggests that annual appraisals have delayed and opposite effect on peer to peer support.
Both variables above, directly (first order) define employees’ Intrinsic Motivation to work and their willingness to stay with a company. After all, can we expect that an unhappy employee, while being in constant competition with his peers and being deprived of an opportunity to safely experiment, would want to dedicate himself to a company for a long time? Probably not, and as a result, Employee Retention should not be expected to be high, and as it has been seen in many cases: good employees that always leave first.
While leveraging, CLDs in my discussions with senior management, I use the following graphic representation and annotation to convey the concept:
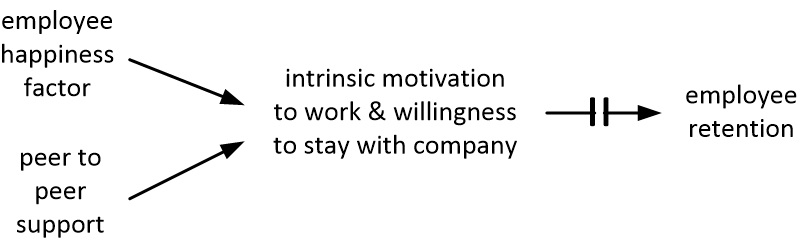
This graphic suggests that both, employees’ happiness and their willingness to support each other, are directly related to their intrinsic motivation to work and willingness to stay with a company, and as a downstream effect – this increases employees’ retention. The opposite would be true as well: lowering values of upstream (left-side) variables will lower values of downstream (right-side) variables.
“Environmental Safety” and Desire to Experiment
Innovation and experimentation are paramount for success in software development. This is what drives feature teams towards improvement. Scrum, for example, requires continuous inspection and adoption. It is expected that, while experimenting, feature/scrum teams may run into roadblocks or have short-term failures, at which point they will learn and improve. But in order to be willing to experiment and take chances, teams need to be sure that they are safe to do so. Another words, they need to be sure that they will not be judged and scrutinized for their interim failures. Such “environmental safety” will be always jeopardized by individual performance appraisals. Why? Because individual success (high individual performance) of an employee is defined by her ability to precisely meet individual goals, set in stone early-on in a year. The need to follow a “script” precisely kills any desire of an employee to experiment. After-all, why would a person want to take any chances if her failures will be perceived by line management as underperformance?
Since appraisals make working environments unsafe and kill individuals’ desire to experiment, as soon as an employee is presented with her annual goals, she reacts self-protectively, by starting to “work to the script”, while trying to document every personal achievement “for the record” (a.k.a. “CYA”)
While leveraging, CLDs in my discussions with senior management, I use the following graphic representation and annotation to convey the concept:

This graphic suggests that when employees are safe and are not feared to experiment, innovation and experiments take place in a workplace. Inversely, lack of safety in a work place and absence of desire for experimenting reduces chances of innovation and improvement.
In the sections below, I would like to take a closer look system dynamics that are beyond the first order of interaction, by tracing some additional downstream system variables:
Team synergy & stability:
In scrum, we would like our teams to be stable and long-lived. We would like to see team members enjoy being a part of the same team, and do so as happy volunteers, not as prisoners, constantly looking for opportunities to escape. In fact, best feature teams known, have been created as a result of voluntary self-organization, not as a result of a managerial mandate.
Why do we want our scrum/feature teams remain stable? Here are some good reasons:
- Collaborative environment and desire to work together
- Shared domain expertize and cross-pollination with technical knowledge
- Predictable team Velocity and ability to plan/forecast more accurately
So, how does team synergy and stability get impacted by performance evaluations and appraisals? Here is how this happens, indirectly:
Via low Employee Retention – as employees leave a company, feature teams disintegrate. This brings together new team members that have never worked together and require time before they can ‘form, norm and storm’. As feature teams get dis- and re-assembled, velocities drop/become less reliable and system variability increases (estimation becomes less accurate). The effect is usually immediate. In my personal experience, I have seen many feature teams breaking lose and falling apart shortly, after companies have announced annual bonuses.
While leveraging CLDs in my discussions with senior management, I use the following graphic representation to convey the concept:
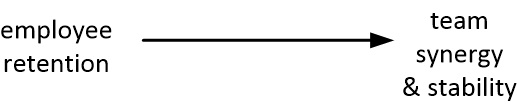
This graphic suggests that high employee retention will lead to elevated team synergy and stability. Inversely, low employee retention in a work place lowers teams’ synergy and stability.
Via high Internal Competition and Rivalry – once employees realize that they have to compete with their own teammates for discretionary dollars, collaboration deteriorates dramatically. Individuals stop supporting each other in pursuit of common goals. Instead, everyone strives to be a super hero and solitary performer, while trying to demonstrate her own efficiency and hyper-productivity to a manager. Everyone wants to look better than other peers and teammates. Race to demonstrate best individual performance has a high cost: it happens at expense of overall team performance. Since collaboration, swarming and shared ownership of work are critical for healthy scrum, the obvious downstream effect of performance evaluations and appraisals not becomes clearer: lowered team synergy and instability.
While leveraging, CLDs in my discussions with senior management, I use the following graphic representation and annotation to convey the concept:
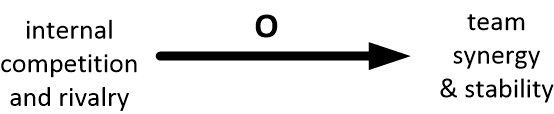
This graphic suggests that internal competition and rivalry will have an extreme and opposite effect on team synergy and stability.
Healthy Scrum Dynamics:
There are many known system variables that interact with one another and define effectiveness of basic Scrum. Assuming that most readers of this post are familiar with Scrum and in order to keep my focus on other important downstream system variables, I am going to leave detailed discussions of basic Scrum dynamics out. It would suffice to mention that the following classic Scrum-specific variables have to be always considered: feature velocity, # of defects, $ rate at which developers are hired (low vs. common), # low skilled developers, cash supply, ability to guide and improve the system, etc. If the reader is interested in exploring this in-depth, “Seeing System Dynamics: Causal Loop Diagrams” section of https://less.works site greatly describes these system dynamics, with the use of CLDs.
However, when leveraging CLDs in my discussions with senior management, I still use the following generalizing graphic representation and annotation to convey this common-sense, overarching concept:
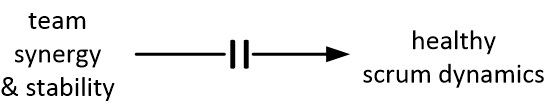
This graphic suggests that team synergy and stability lead to healthy Scrum dynamics and a feedback loop is positive (value increase on left leads to value increase on right). In my experience, the effect is sometimes delayed. A time lag is usually due to previously gained momentum.
So far we have used CLDs to explore system dynamics that primarily impact technology teams. At this point, would like to shift my focus on business side of the house and explore the part of system dynamics that involves customers. In particular, I would like to provide some examples of how CLDs can expose the adverse impact of individual performance appraisals and discretionary monetary incentives on Product Ownership in Scrum.
Identification of GREAT Product Owner:
Finding a good candidate for the role of Product Owner has been one of the most challenging tasks in Scrum. Why?
The role of Product Owner combines certain characteristics that are not easily found within the same individual, and it is organizations of high organizational complexity and Tylorian culture, where this challenge is seen most. On one hand, Product Owner is expected to have enough seniority and empowerment to make key strategic business decisions. On the other hand, Product Owner is expected to get intimately involved in day-to-day, and sometimes, hour-by-hour interaction with technology groups. When these two sets of characteristics come together in the same person, we hit a jackpot: we get a great Product Owner – a person who is both Empowered and Engaged. But truth to be told that it is often challenging to identify a person that possesses both “Es”. In most Orange organizations (the predominant color of most modern corporations, as per Laloux Culture Model), definition of every job includes a fixed set of responsibilities that individuals are obligated to fulfill. If we look at most job descriptions, as they are defined by HR departments of Orange companies, we will hardly ever see a job spec that has ”slack time” for an person to take on responsibilities of Product Owner, in addition to his primary job, let alone a job spec that in fully dedicated to the role of PO. For most organizations, Product Owner is still not a well-defined role and as such, it is not perceived by employees as a step towards career advancement. Today, many organizations that use scrum have to experiment with the role of PO, by looking for right individuals, internally. Individuals that step up for the role if Product Owner have to make a conscious decision, with full acknowledgement that they will be taking a very wide spectrum of new responsibilities. For most people, this is risky, because, effectively, it means that attention and focus on primary activities (as per job specs) will be diluted by secondary activities – fulfilling the role of PO. Of course, this problem could be easily mitigated with full backing and support, from senior leadership and HR, by redefining job specs and explicitly recognizing criticality of Product Owner role. But it hardly ever happens (and mostly, at product development companies).
It is hard to argue that people have to be recognized for the work that they do. I doubt that anyone would object to the following statement: nobody should be working two jobs for the same pay check. People have to “feel safe” about stepping into a new territory, learning new activities and developing work dynamics that they have not experienced before. This brings us to the same concept that we discussed earlier, when we looked at technology groups: individuals need to feel safe, in order to be willing to experiment with a new role. It would be unreasonable to expect an employee to take on more work that would not be “counted in” when a person gets evaluated for his contribution to an organization.
So again, while leveraging CLDs in my discussions with senior management, I use the following graphic representation and annotation to convey the concept:
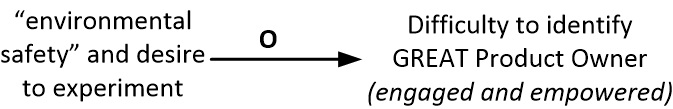
As the graphic suggests when employees are safe and are not feared to experiment, it will be less difficult to identify a good Product Owner. Inversely, the opposite is true as well: lack of safety and inability to experiment makes the process of Product Owner selection much more challenging.
At this point, it is worth mentioning one very common Quick Fix that organizations frequently make to compensate for shortcomings in finding a good Product Owner:
Empowerment usually implies that a person occupies a senior organizational position. As such, a business person’s career has progressed beyond a certain point; she no longer has enough bandwidth (nor desire!) to deal directly with technology. Once reaching a certain level of seniority, a person gets a “bigger fish to fry” and collaborating with individual technology (feature) teams is no longer her priority. So, while still retaining one of the “Es” (Empowered), a person is not able to demonstrate another “E” (Engaged). In order, to compensate for the missing “E”, another person needs to be “inserted” into the system, to fill in the gap between a real Product Owner and technology teams. This, poorly-defined (undefined) role is sometimes labeled “PO-proxy” – a surrogate person tries to act as PO but does not have the power. This role is usually occupied by someone from a lower organizational layer: a business analyst, system analyst or another person – someone who is more accustomed to work directly with technology and for whom the activity itself is not perceived as “below pay grid’. This creates a serious dysfunction in scrum operating model, as communication between a true customer (empowered Product Owner) and technology is now hindered: a surrogate role of PO-proxy usually lacks strategic/holistic product vision and power to make important business decisions within short timeframes, as it is required by Scrum.
It is worth noting that functional expertize of a business analyst or systems analyst are both welcomed in Scrum and usually reside within teams (although single-specialty individuals are viewed as less valuable than multi-skilled, a.k.a., T-shaped individuals).
The reason why delegation of responsibilities described above is problematic is because it artificially creates unnecessary communicational layers between end customers and technology. This type organizational design causes a variety of additional dysfunctions (miscommunication, hindrance to information flow, confusion of priorities, etc.), and therefore strongly not recommended.
While leveraging CLDs in my discussions with senior management, I use the following graphic representation and annotation to convey the concept:
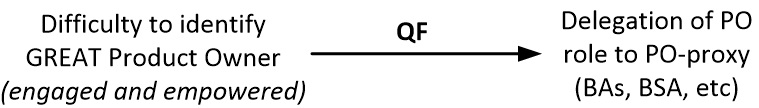
As the graphic suggests, difficulty to identify a good candidate for the role of Product Owner creates the need to look for quicker and cheaper solutions; introduction a powerless surrogate role of PO-proxy is commonly seen, undesirable ‘Plan B’.
The reason why this fix is “quick” – because it usually does not take too long for a real Product Owner to realize that he/she is not able (or willing) to handle additional responsibilities of the role. In my practice, risks of losing a real Product Owner and getting a proxy instead, did not take too long to materialize: usually a few weeks after Scrum was introduced.
Effectiveness of Product Backlog management:
Effective Product Backlog management is paramount in agile product development. This is the fundamental concept that has been introduced in simple Scrum and it remains as valid in scaled Scrum. In fact, when an organization scales its Scrum, by involving multiple technology teams, Product Owners and lines of business, effective product backlog management becomes even more critical: work coordination, resource management, impediment removal, alignment of business priorities etc.
As we can guess, effective product backlog management, including work prioritization, story decomposition etc. can be done most effectively with participation of a real Product Owner. And oppositely, if an organization is missing the critical figure of Product Owner, product backlog management will become ineffective.
While leveraging CLDs in my discussions with senior management, I use the following two graphic representations and annotations to convey these two related concepts:
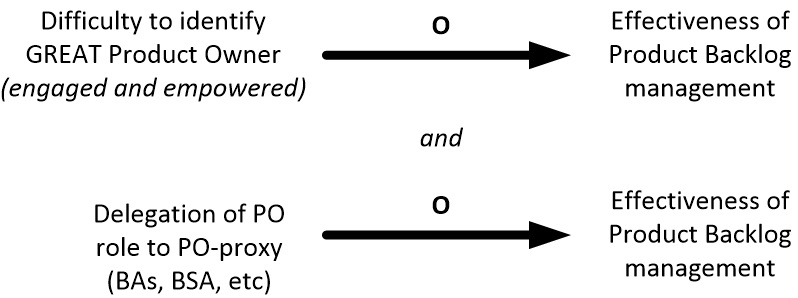
As the graphic suggests, product backlog management suffers from both: lack of true Product Ownership and presence of ineffective surrogate roles. In my personal experience, the effect is usually extreme.
Healthy Scrum dynamics (overall):
At this point, I usually provide senior managers with a partial summary of LCD, by showing how ‘healthy scrum dynamics’, while sitting much further downstream from individual performance evaluations, appraisals and bonuses are still impacted by the latter group via second order dynamics (through secondary variables). CLDs do a great job of bringing many aspects of system thinking together and presenting them visually.
Below is the combined view of how four upstream system variables that we have discussed earlier relate to ‘healthy scrum dynamics’:
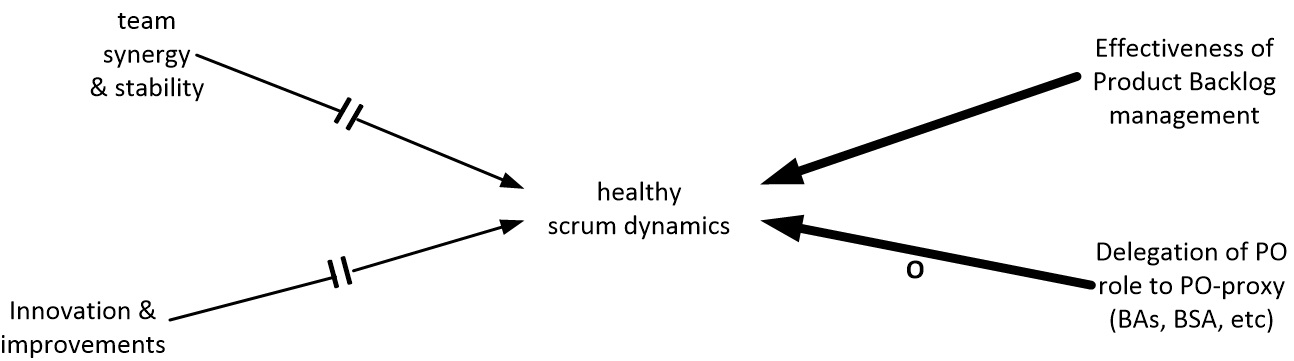
As the graphic suggests, nature of the effect (positive vs. negative), time of onset (immediate vs. delayed) and impact (casual vs. extreme) are could be unique for each variable.
Scaling Scrum and Organizational Agility:
In this section, I want to describe how I, with the use of CLDs, bring my discussions with senior management to culmination, by painting a bigger picture of organizational agility.
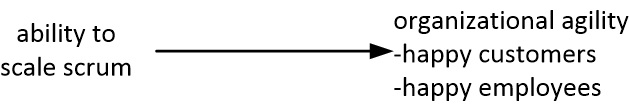
For most large organizations, success by a single team is not the end goal. Organizations look for “bigger” solutions. And their reasons are obvious: huge IT departments, many lines of business, many customers, multiple competing priorities, multi-year strategy, and many other elements that make organizational needs nothing less of huge. Luckily, most of organizational leaders that I have met in my practice, understand that the ability to effectively scale basic agile frameworks (e.g. simple Scrum) will ultimately improve organizational agility and ensure that both customers and employees are happy.
Below is the graphic that summarizes this last, ‘common sense’ relationship:
Tying it all back:
What I would like to do at this point, is to make one step back and describe what it takes to scale scrum effectively:
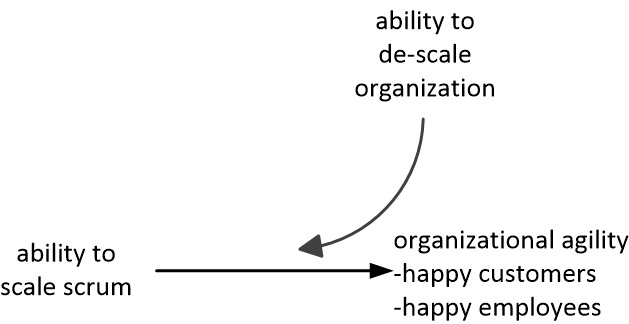
This is where another powerful concept of LeSS comes to rescue: in order to scale Scrum, an organization must be descaled first (please refer to “Less Agile or LeSS Agile?” by Craig Larman). Other words, to construct a model of Scrum, performed by multiple teams, an organization must remove (deconstruct) its existing organizational complexly first. As it was stated at the beginning of this post, scaling does not imply making things more complex, but unfortunately, this key concept is not always well understood. Mistakenly, many people still think that in order to support existing organizational complexity they need to look for multi-tiered, complex agile frameworks that will provide “room and purpose” for every existing organizational element: roles, processes, tools and techniques.
The analogy that I frequently use to deliver the concept of scaling to senior management is that building a sky scraper on a wobbly, porous foundation is dangerous because it will eventually crumble. A surface must be cleaned up first, flattened and hardened, and only then there will be a chance to build something tall and strong.
Below is the graphic that summarizes this concept:
At this point, the most common request I get from senior leaders is to elaborate on what I mean by ‘de-scaling’ – and this is my favorite topic. This question is natural but I usually resist on answering it immediately, since the topic is inherently large, complex and, at times, inflaming and therefore, I request a dedicated discussion for it.
However, I still produce CLD graphic illustration of the concept, as shown below, but offer a follow-up discussion to explore details:
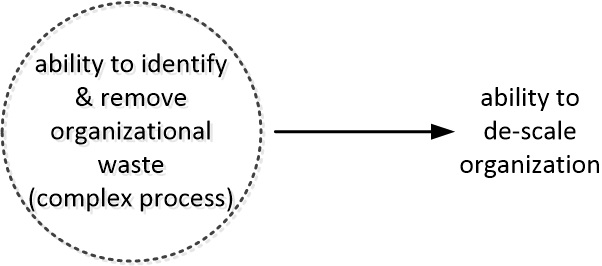
Ultimately, when such discussion is held, I always tie it back to the present discussion and explain why “Goal: distribute discretionary incentives” becomes so trivial with identification and removal of system/organizational waste. This discussion is usually long and it requires challenging many outdated organizational norms and principles that some senior leaders are not willing to give up easily.
The CLD graphic illustration is a high-level generalization of the concept of the opposite (inverse) relationship between the two system variables:
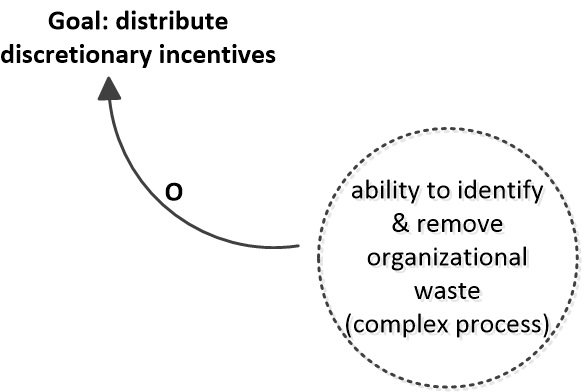
As mentioned above, the variable in the dotted circle can be decomposed further into many, smaller system variables that have up- and downstream relationship with one another.
Summary:
The best summaries are short. Therefore, I would like to summarize this post briefly, with one comprehensive CLD diagram that brings together and variables, relationships and annotations that were discussed so far:
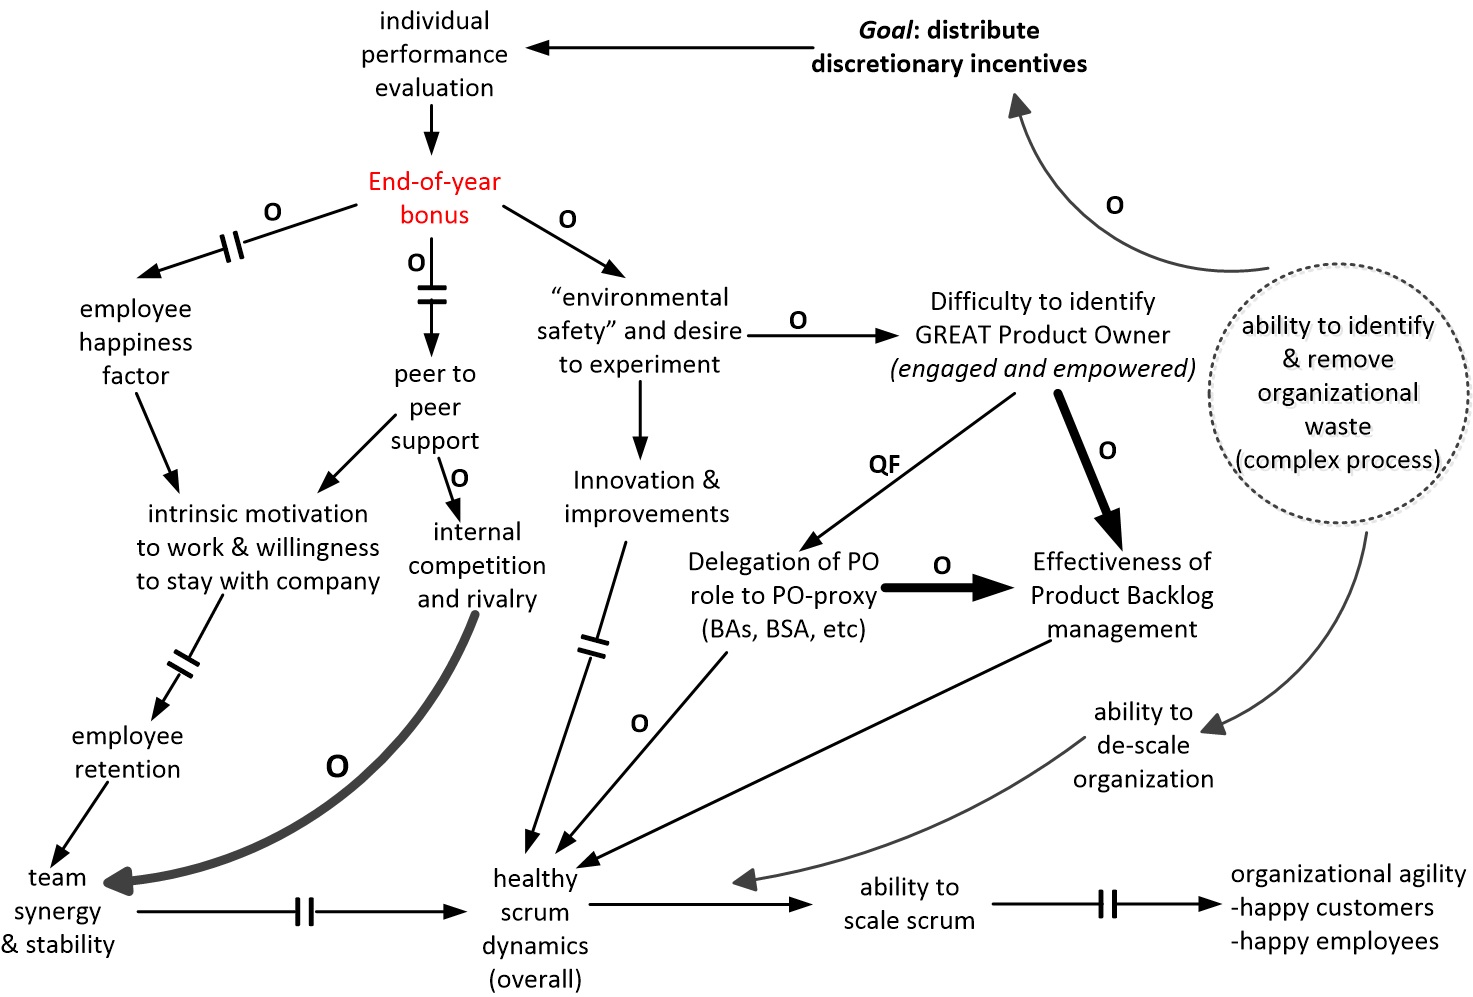
Although it may take hours, or sometimes days of brainstorming to produce CLD, when complete, it becomes a great communication vehicle. A diagram like this one can be created real-time, in collaboration with others, on a white board. Alternatively, it could be created ahead of time by a coach or trainer and then be used as a ‘cheat sheet’, when appropriate. CLDs can be also shared with wide audience ahead of time, to solicit questions and provoke interesting discussions at later point.
And it’s been moved from SA page too:(
“This article is currently not available. We apologize for the inconvenience. Please check back again later.”
Hello Michal,
Thanks for your post.
I am afraid you are right, due to Scrum Alliance site remodelling, the moved the article to the location that is not known to me at the moment.
Luckily, the article is the part of my Green Book:
https://www.keystepstosuccess.com/wp-content/uploads/2018/05/The_Green_Book-May-2018.pdf
Please, download this free pdf and go to page 80.
I hope you will find the publication useful.
Best,
Gene
Here is the ScrumAlliance version again: https://www.scrumalliance.org/community/member-articles/1517
Hi Mark,
Seems like Causal Loop Diagrams map fairly well to the Current Reality Tree in the ToC Thinking Processes.
Would you agree?
I’ve not used CLDs so wondering how it can further map to ToC TP if at all. The Future Reality Tree and the Transition Trees (of which there are a few).
Regards,
Nick